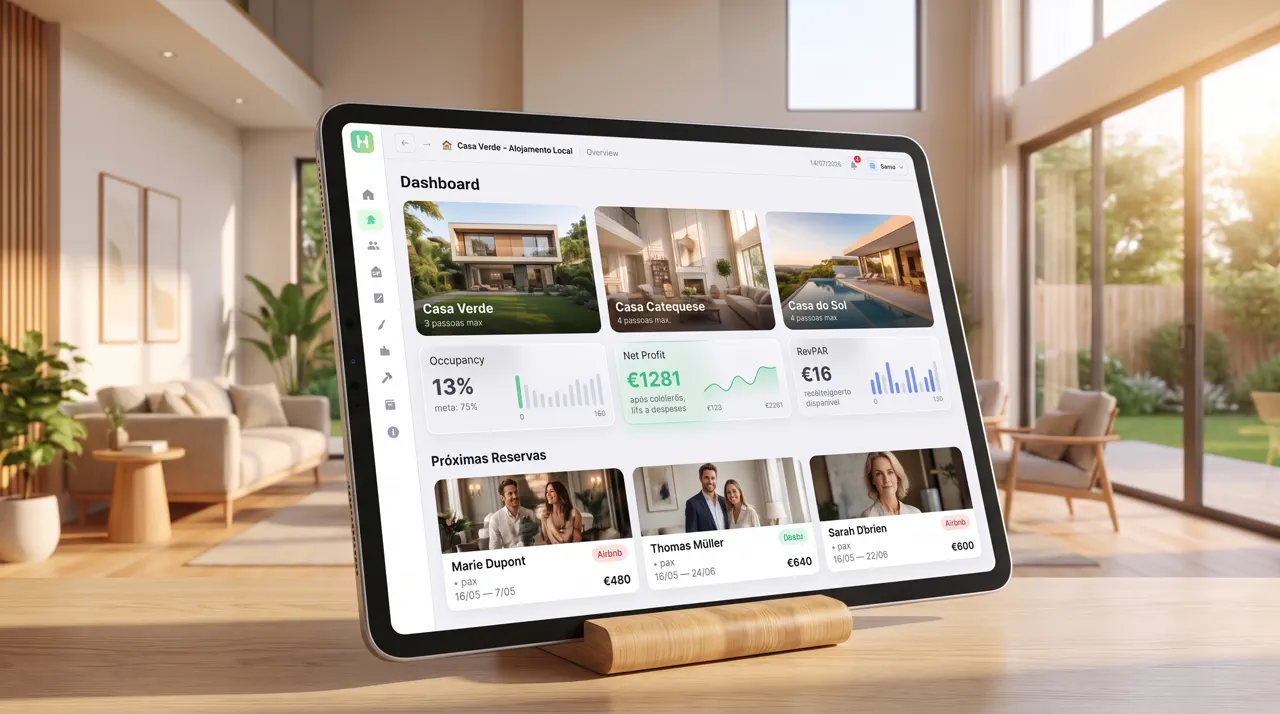
The big picture only at month-end
The overall picture only appears once you link everything by hand, instead of automatically.
Running several businesses at once? Bring everything into one place.
One spreadsheet per operation, an app for each area and information scattered across files.
The overall picture only appears once you link everything by hand, instead of automatically.
A different spreadsheet or app for each area, with no place that brings it all together.
Invoicing, expenses and deadlines spread across different files, spreadsheets and folders.
Each operation in its own module, with the fields that fit it. The system sums everything in real time and gives you the group view — without stacking up more spreadsheets.
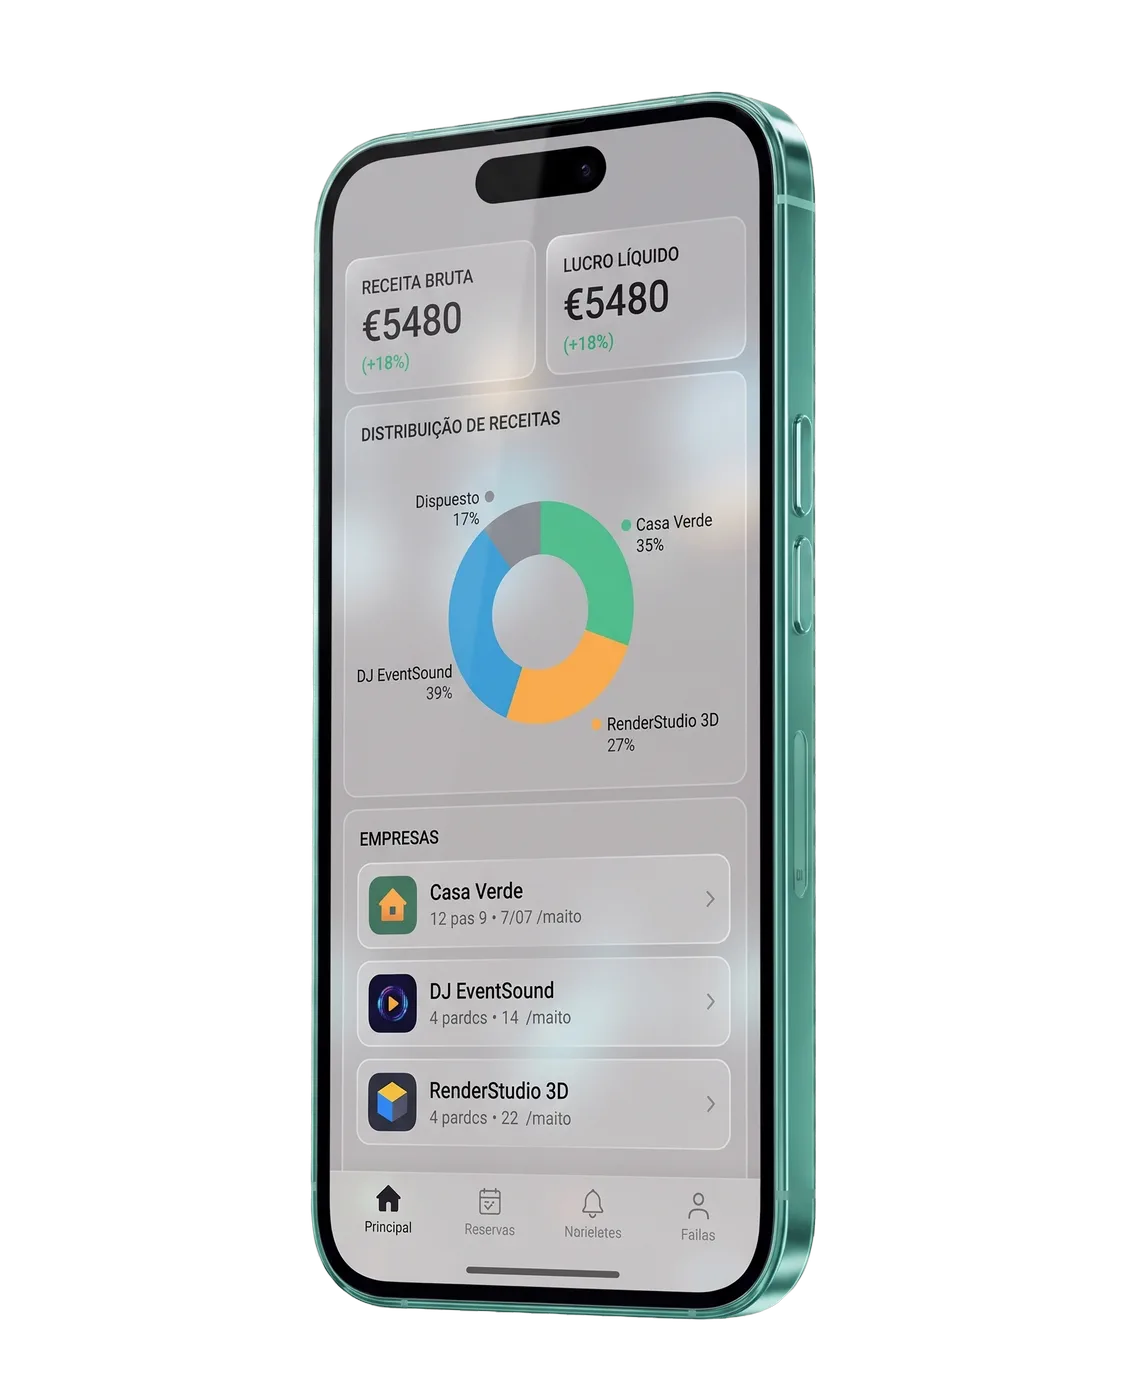
Invoicing, expenses, profit and active businesses of all, on one dashboard.
Each operation runs its own way; when a business appears, a module is created.
Net profit per operation and the group total, with quarterly and annual projections.
Your salary comes from what you invoiced; taxes and inter-operation debts in one place.
Bookings, events, deliveries and tax deadlines, colour-coded by business.
New business, new module — from content to events, consulting or personal finances.
As entrepreneurs, we feel the daily struggle of running several projects at once. This app was born from that need: a system that brings everything together, automates tasks and gives a clear view of the businesses. The full detail is in the PDF.